
At Warner Bros. Discovery (WBD), we tell stories that entertain and inspire our viewers, communities, and each other through a diverse array of content, from blockbuster movies and beloved TV series to captivating documentaries and live sports.
Regardless of the product, my goal has always been the same: deliver reliable, observable, cost-aware systems that empower developers and support the business. That mindset is what guided our work in launching discovery+, building Max from the ground up, and scaling it globally. All while embedding cost-efficiency into the DNA of our engineering culture.
This is the story of how we did it. How we learned, iterated, and sometimes stumbled, but never compromised on what mattered: quality content, a seamless experience, and the systems and people that make both sustainable. In this blog, we’ll explore the crucial steps that shaped our journey: establishing concrete measures for efficiency, illuminating costs through self-service transparency, and tackling potential roadblocks early on – all of which were instrumental in embedding cost-consciousness into our engineering culture.
“Discovery-ing” Our Foundation for Frugality
Back in 2021, before WBD existed, I joined Discovery Communications as the Director of Observability in the direct-to-consumer (DTC) organization. I arrived a few months after DTC had launched its new standalone, full-featured, direct-to-consumer streaming platform, discovery+. At the time, I was chartered with standardizing our Observability tooling and reducing the diaspora of products used to provide operational intelligence. It didn’t take long to realize that the biggest opportunity wasn’t which open-source or 3rd party tool to pick for our logs, metrics, and traces instead, it was more foundational. I needed the organization to align on taxonomy, or the vernacular we would use to describe our systems, before technology.
At the time d+ was built, competition in streaming was fierce (it still is!). Speed of delivery and subscriber acquisition is critical. To support this, teams were provided substantial autonomy when it came to deciding on the technology they would use, the processes they would adopt, and how they would classify their systems via metadata, tags, and schemas.
The approach worked – d+ launched quickly, but the trade-off was difficulty in rationalizing the platform as a whole. I remember comparing cloud vulnerability scan Amazon Resource Numbers (ARNs) to our resource inventory, taking hours to identify capabilities, ownership, and repository links due to inconsistent naming conventions. This added complexity to issue triage, incident management, and cloud cost allocation.
The adage “There are only two hard problems in computer science: cache invalidation, naming things, and off-by-1 errors” certainly applied. To tackle this challenge, I crafted the Operational Metadata schema (OMD). The schema answered key questions for every repository, cloud resource, and container:
- What hierarchy of functionality does this support?
- How does this functionality vary across global markets and products?
- Who is responsible, how can they be contacted, and how do you request work from them?
- How business critical is this function?
The schema was stored as a configuration file within each component’s code repository and applied as tags on AWS resources and labels across Kubernetes pods. My team ensured that once a resource was labelled, our observability capabilities propagated this metadata to every log and metric produced by D+ and activated them as Cost Allocation tags.
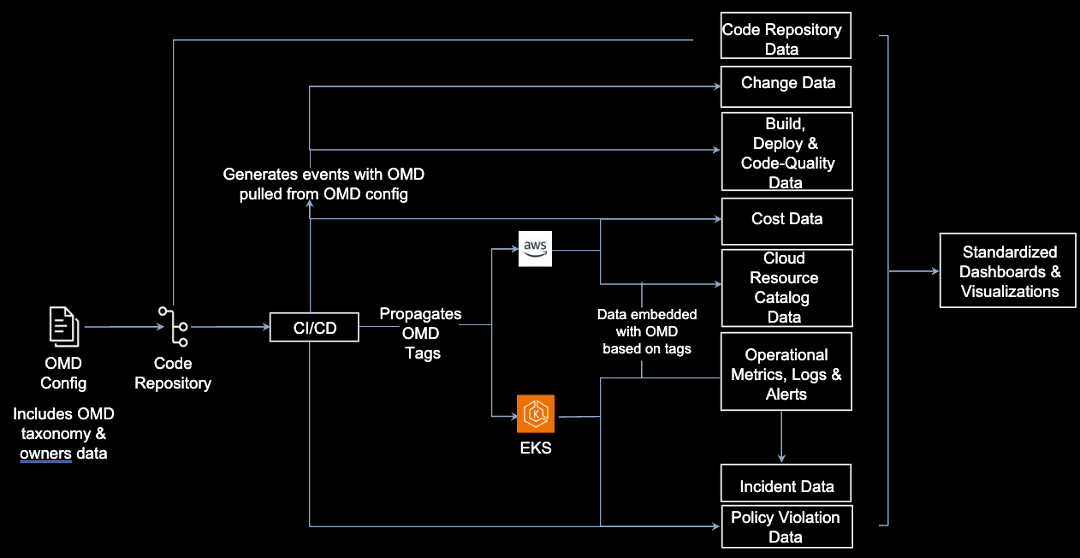
Rolling out OMD took six months, with engineers applying OMD to over one million (91%) of our cloud resources. Eventually, the days of combing through spreadsheets faded. By referencing OMD tags and fields engineers could easily understand what d+ functionality supported by individual pieces of infrastructure, financial analysts could allocate costs to specific teams, and operators triaging system symptoms could trace metric labels back to originating repositories and their corresponding configuration changes.
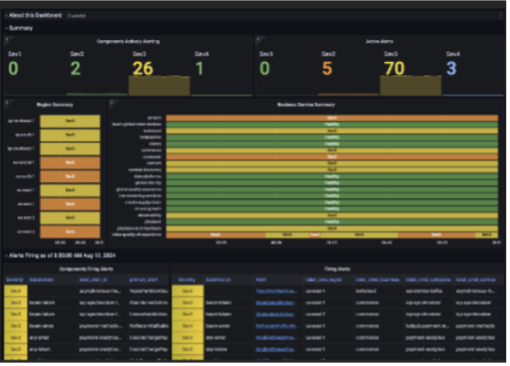
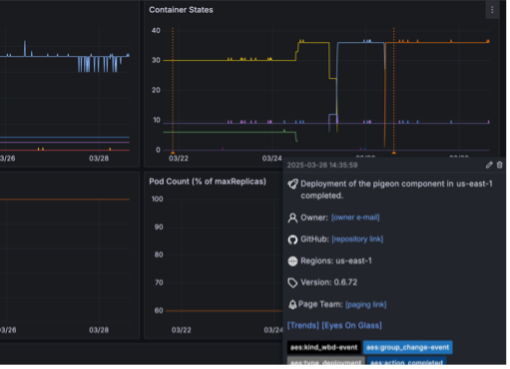
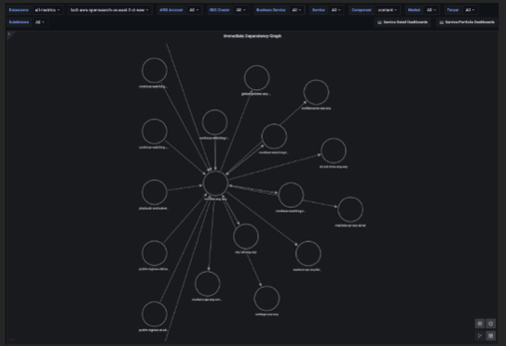
More importantly, OMD’s implementation had become a dynamic inventory of our entire ecosystem. It provided a foundation for additional automation and standardization across the service portfolio. One of the first examples of OMD driving standardization was the creation of a unified operational dashboard environment named the Observability Station, or OSTAT for short. OSTAT provided users consistent out-of-the-box views of microservices that let them understand, triage, and act on operational needs whether they are incidents and alerts, deployments, service health KPIs, or scaling-related information. Standardizations like OMD and OSTAT became crucial as we began planning our next streaming platform.
Max Launches and the Succession Finale
In 2022, Discovery and Warner Media merged to form Warner Brothers Discovery. Shortly after, the digital organization was tasked with launching a new streaming platform: Max. We had 9 months to build the platform. The technical foundation was to be a ‘best of both’ solution, evolving from both companies’ historical streaming applications, with lower operating costs per subscriber. On launch day it was expected that all HBOMax users in the US would seamlessly migrate to the new system so that the HBOMax application could be immediately sunset. Five days post-launch Max would be the sole streaming host of the series finale of HBO’s hit show Succession.
Sunday nights are crucial to Max. Premier content, like Game of Thrones, Succession, and Euphoria, is released simultaneously on linear and digital platforms which causes a significant increase in requests per second (RPS) to our core APIs. Pre-scaling the platform was essential as autoscaling couldn’t always keep up with the acceleration in RPS.
Post-merger, my leadership span increased, and I was charged with building Max’s Site Reliability Engineering (SRE) function. My vision was that this team would improve the reliability, scalability, and cost-effectiveness of the Max platform through capacity management automation, load testing, fault injection testing, and operational tooling. We were heavily involved in ensuring Max was operationally ready for launch and that it could effectively host the Succession finale.
We performed weeks of near non-stop load testing in non-production environments to prepare. The scale required to support this activity was substantial and so was the cost. To be fiscally responsible we needed to find a way to reduce the system scale efficiently between tests and over weekends without interrupting the testing cycle. At the time, we identified two options: update minReplica configurations across 100s of Helm charts and independently redeploy each of these services before and after each load test or use a script to scale the entire service portfolio in place. The latter was faster and required less coordination but was prone to instability. Any net new service deployment would reapply it’s minReplica configuration and supersede the pod count applied by the script. Given that we were prepping for launch, many of our services were deploying multiple times a day rendering this approach unusable as well.
The SRE team partnered with Max’s CI/CD platform team to design a minReplica override capability which provided the flexibility and autonomy of the script with the ability to prevent new deployments from deviating from the settings SRE put in place. When the override was turned off, services defaulted back to their scaled-up state recorded in their Helm configurations. This enabled daily scaling up and down, ensuring compute costs remained low when not in use. We’ve kept the capability on in our non-production environments since launch where it has successfully prevented inadvertent scale-ups and maintained cost-control.
We also realized that the minReplica override had other use-cases beyond scaling suppression. The tool could increase minReplicas above their Helm values to force portfolio-wide scaling-out as needed too – a feature that has turned out to be incredibly valuable when preparing for anticipated high traffic events or when responding to an incident where autoscaling just doesn’t work as expected. The capability has become a core part of SRE’s operational toolkit where it has been utilized across hundreds of episode premieres such as House of the Dragon and White Lotus or for live-sporting content that Max and d+ distribute across the globe.
Founding the Fellowship of Savings
After successfully launching Max, Cloud Financial Operations (FinOps) was added to the SRE organization’s charter. Simultaneously, the broader engineering organization was gearing up for a global expansion of Max to Latin America, Europe, and Asia Pacific over the next 1.5 years. The new regions and infrastructure needed to support this rollout would drive additional cloud costs and with my recently expanded mandate it was clear that I needed to lead the charge to temper this growth. I remember looking at the efficiency opportunities across the portfolio of 400+ microservices and hundreds of datastores that power Max and realizing there was no way that SRE could do this on its own. We needed help and to do that we needed to embed cost consciousness into the engineering organization’s DNA. I identified three key aspects to make this a reality…
Establishing Concrete Measures for Platform Efficiency
First and foremost, there was a need to set and gain buy-in for savings targets that I could rally the engineering organization around. With the complexity of the platform and its global expansion in mind, setting traditional financial targets like “save $x/mo in cloud costs” didn’t seem sensible. I wanted to align our costs to something more tangible – business measures that could accommodate the growing platform, clearly identify efficiencies gained (or lost), and be easily understood at all levels of the organization. There were two dimensions I wanted to target to drive cost reduction: overall platform efficiency and category of spend.
I landed at cost per subscriber (CPS) as the initial efficiency measure for the Max platform. As Max expanded across global markets, subscriber count would grow, offsetting the need to build out new cloud infrastructure for these regions. The expectation was that optimizing workloads would decrease CPS, and expanding Max globally would keep CPS stable or decrease due to reduced influence of fixed costs like non-production environments.
To optimize spend distribution across categories, I leveraged the OMD schema adopted throughout the Max Software Development Lifecycle (SDLC) after its success in d+. This enabled us to aggregate costs into macro spend categories we wanted to balance on Max:
- Functional Costs – cloud costs dedicated to business logic (e.g., logging in, browsing, playing back video, back-office functions)
- Observability – cloud costs supporting operational data (logs, metrics, traces) for triaging, investigation, and mitigation
- Business Intelligence – costs associated with capturing client events, behavior, and analytics
With measures identified, the next step was setting realistic goals for the organization within our organization’s Objective and Key Result (OKR) framework. Using the OMD taxonomy, we crafted standardized operational reporting across most of the Max portfolio, surfacing resource utilization (CPU, Memory, Storage, metric & log generation) and identifying macro-opportunities across the platform.
As a result of this analysis, we set the following OKRs for 2024:
- Reduce compute’s (EC2 & EC2-Other) contribution to CPS by 50%
- Reduce database’s (RDS, Dynamo, Keyspaces, Elasticache) contribution to CPS by 25%
- Reduce Observability’s proportion of cloud spend by 50%
Once these OKRs were set, I included a review of their progress in monthly business reviews with Max’s senior engineering leadership and finance teams. This ensured consistent attention to the endeavor and allowed for prioritization adjustments across the digital organization as needed.
Shedding Light on Cost through Self-Service Transparency
Once I had executive buy-in and visibility, I needed to ensure teams had the right insights to inspire action on the costs they owned. I wanted individuals to understand the costs aligned to their services, correlate them to their supporting cloud services, and know how to control these costs. Tools like Cost Explorer and the OMD tagging schema provided some insight into cloud spend but only covered part of the picture.
At the time, Cost Explorer only provided cost insights at the EC2 node level. Max’s services are deployed as containerized workloads in AWS EKS across multiple regions (US, LATAM, EMEA, APAC), AZs, and nodes. Each EC2 instance in an EKS cluster could have dozens of pods from services across Max’s portfolio, making it difficult to correlate pod costs to EC2 instance costs and aggregate a service’s cost globally.
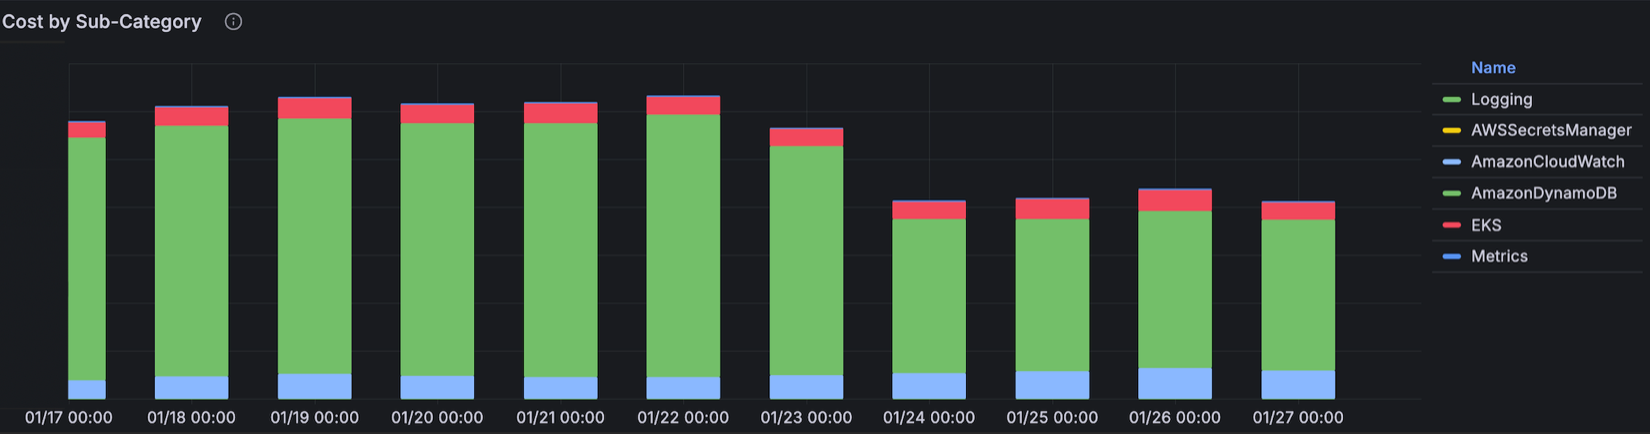
We built Max’s Observability platform using AWS services (Kinesis, OpenSearch, S3, Amazon Managed Prometheus [AMP], TimeStream), OSS agents/collectors, and homegrown capabilities. Because the underlying cloud instances were shared engineering teams couldn’t use existing cost tools to determine how the services they owned impacted Observability costs. While operational data showed how much each service was logging, teams couldn’t translate that into dollars or compare it to compute or datastore spending.
To address this, I launched a program across SRE, Observability, and data insights teams to create a cost metering solution creatively dubbed the “Self Service Cost Allocation Tool.” We used the OMD tags of shared systems, such as Observability and EKS EC2 compute, to aggregate cost data from the Cost and Usage Report (CUR). The solution aligned the cost data to system utilization measures defined for each domain. Observability used log volume metric count and EKS costs were split using container level CPU/memory. Because we decorated these utilization metrics with OMD tags we were able to tie the percent of total usage, and therefore cost, back to individual microservices in the portfolio.
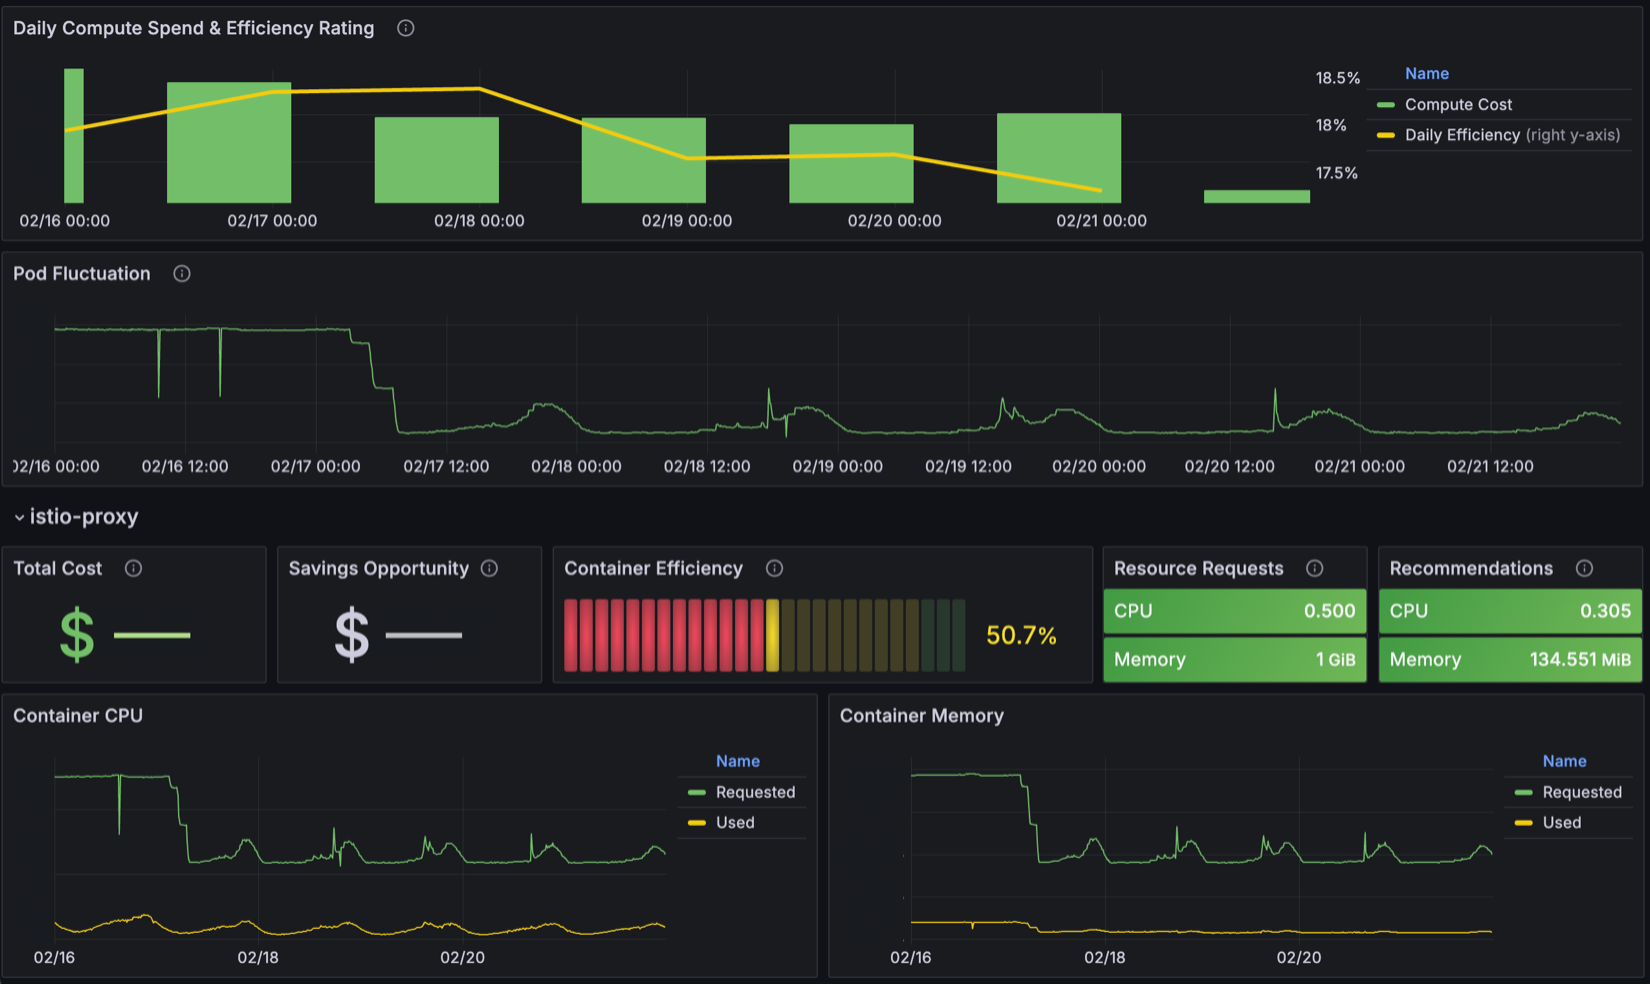
Self Service Cost Allocation was integrated with OSTAT, which we had carried over from d+. This made it easy to set up standardized cost views for product groups, senior leaders, and engineers. Teams could view both cost and operational data in the same visualizations, correlating cost drivers due to scale-ups, configuration changes, or new deployments. Additionally, consolidating this data the team built tooling that could identify how efficient individual components were being with their spend. Using these new capabilities our FinOps team was able to identify our least efficient services, generate right sizing recommendations, and work with engineering teams to implement cost-saving actions across the portfolio.
Target the Doors that Will Lock or Get Stuck Early On
While the cost allocation views provided insight into the drivers of existing costs, there was still a need to embed cost consciousness earlier in the SDLC. We needed something to help identify design decisions that could become prohibitively difficult to pivot from, or a “closed door,” if implemented. At the time Max already had a robust Architectural Decision Document (ADD) process that ensured that the architecture of net new capabilities was thoroughly reviewed and agreed on by our principal engineering community. At first, the focus of these documents was mostly on scalability, reliability, and integration into existing systems. Going into 2024, FinOps ensured that cost estimates were required as a part of these documents. Not only did this type of upfront analysis help to better inform the design decision but also helped to better inform FinOps forecasts for when these designs were incorporated into an implementation roadmap.
One of the biggest domains of “closed door” decision making is our databases. How data is modelled, what databases are chosen (SQL v. NoSQL), and how data is replicated are all costly decisions that are difficult to roll back after implementation. To ensure these potential issues are caught early on we utilize a collaborative process that ensures the Database Reliability Engineering (DRE) team reviews these changes prior to implementation.
During the Max APAC expansion, one of our services was expected to expand from the US & EMEA into the new market. The service was initially setup to use what we called a ‘global architecture pattern.’ This would translate into the service increasing its presence to three new AWS regions in Asia and require that its 20TB of data in DynamoDB (DDB) be replicated across every region Max had presence. As a part of the effort, DRE consulted on the strategy and identified that the existing data model, frequency of change in the US and EMEA production tables, and volume of data stored would result in a doubling of costs. The teams collaborated on an approach to convert the service to a ‘market-specific architecture pattern.’ This still required the service to have presence across all of Max’s AWS regions but removed the need for Dynamo global data replication. While it required a bit more engineering effort up front the approach not only prevented the expansion cost but also reduced the existing Dynamo run-rate by 40%+ after replication was halted between the US and EMEA.
Building and Adopting Appropriate Scaling Capabilities
Insight may inspire action, but teams need the right tools to make it happen. Many services in Max’s portfolio communicate over a service mesh with synchronous calls. Kubernetes’ default Horizontal Pod Autoscaler (HPA) works well here, scaling pods based on CPU and memory utilization. However, some services use an event-driven architecture which does not mesh well with the default HPA.
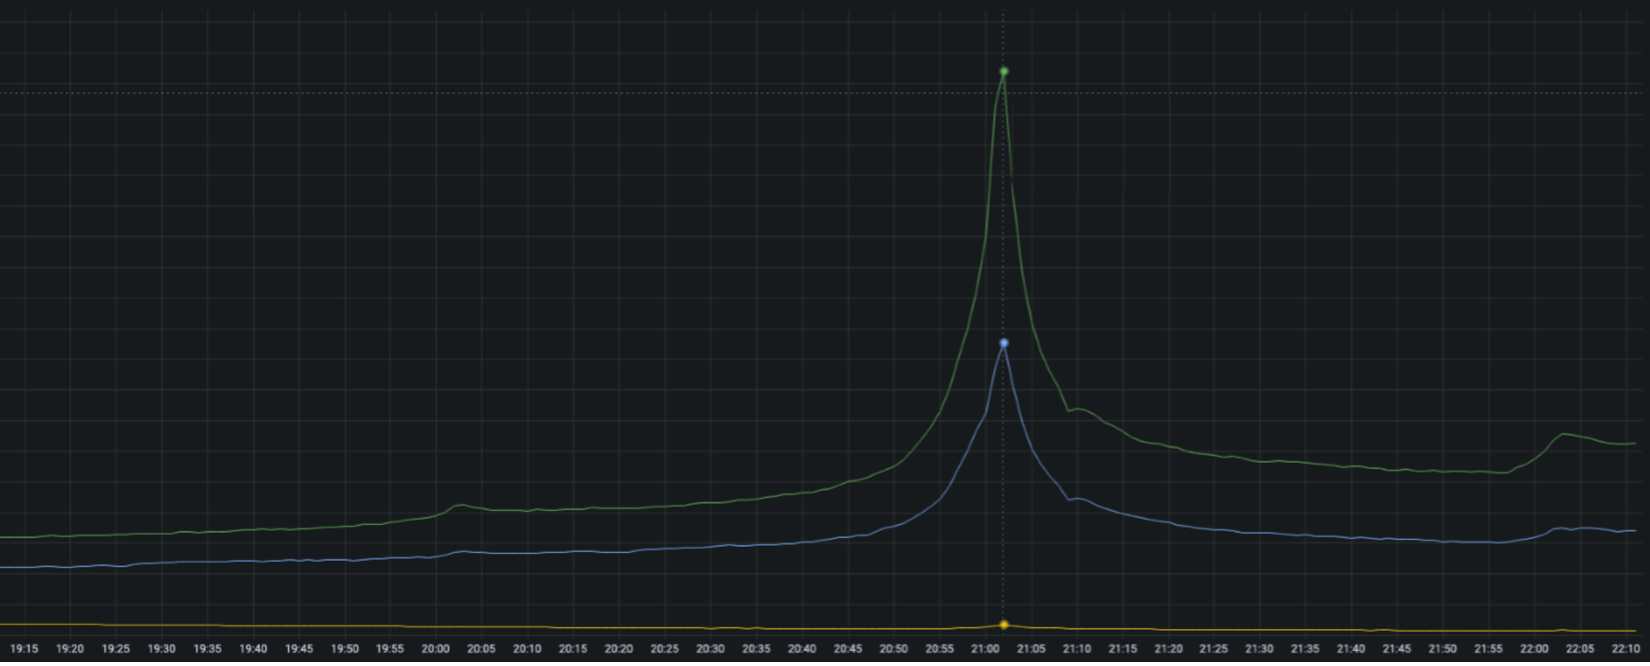
Max’s “Continue Watching” feature is a clear-cut example. As viewers enjoy their favorite shows, their devices send ‘marker’ messages with metadata about the title and the most recently viewed point at a regular interval. These messages are placed in Amazon SQS, then pulled from the queue by a Kubernetes-based microservice, and the latest timestamp of the title is eventually written to a datastore. The rate of marker ingestion grows with concurrent viewers which increases SQS’s queue length if consuming services don’t pull messages faster. Initially, scaling was managed through HPA CPU thresholds, but the correlation between CPU and SQS queue depth was weak, causing volatile autoscaling and increased costs.
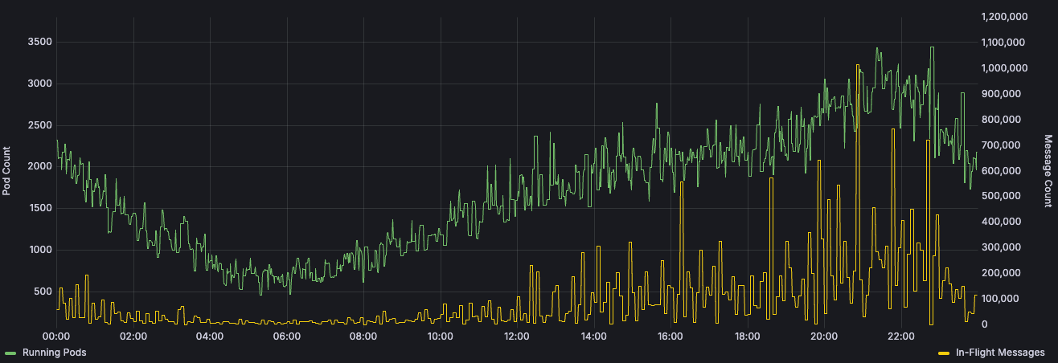
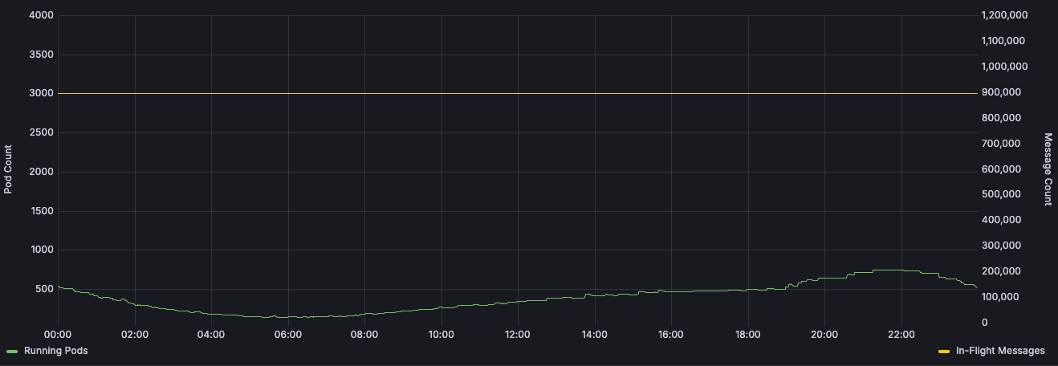
The SRE team tackled this by integrating Kubernetes Event Driven Autoscaler (KEDA) into the Max platform. KEDA scalers hook into various cloud services and metric datastores which enables them to horizontally scale Kubernetes resources beyond the default HPA metrics of CPU and memory. SRE worked with the markers team to configure a KEDA scaler to manage the service’s pod count based on SQS queue length. After a few weeks of refining the scaling thresholds, the teams stabilized the service’s scaling. Providing the right tools to engineers helped maintain a steady queue depth, smooth out the scaling curve, and reduce the average running pod count (and therefore cost) by ~75%.
When Optimizations Don’t Go to Plan
We often repeat the mantra of “Don’t be Frupid” when discussing cost savings in the streaming organization. The intent is that we should always attempt to make our systems more efficient but that we should ensure we do not compromise customer experience and product stability on that journey. Despite these best intentions, systems can and do surprise us in unexpected ways. When this happens, we use this opportunity to learn from these events to make our system more resilient and efficient.
As we rolled out Max globally, our confidence had grown in our standard scaling procedures – at this point they were effectively “old hat.” As we launched each new market, we repeated the approach used for the US launch: load & fault injection test new infrastructure, scale-up for initial activity, and then reduce capacity and spend to a cost-optimized level. By the EMEA launch, the SRE team’s use of the capacity override SOP was routine. We used it for BAU operations like DB upgrades, major content launches, and incident mitigation. Given our prep work and tool standardization, we were confident the post-EMEA launch scale-in would go smoothly.
After launch activities kicked off, SRE processed the scale-in SOP and all was green… until 20 minutes after the change. Suddenly, failures spiked across all 3 EU regions. The team quickly reinstated the scaling overrides to restore service. It wasn’t clear why the system failed: other markets handled higher RPS with fewer instances, and the EU regions had been load tested without issue. SRE and service engineering teams kicked off our post-incident review process which we’ve dubbed the “Celebration of Error.” Typically, this is a document driven reflection of both system and people behavior during the incident. Given the complexity of the issue the teams decided to go a step further by replicating the event in non-production. Together, they executed load and fault injection scenarios to replicate the event conditions. As a result, we were able to precisely identify multiple contributing factors, not a single root cause, which led to the incident.
| Contributing Factor | Implemented Remediation |
|---|---|
| The scale-in SOP was actioned across an entire market (3 AWS regions) at once which increased the blast radius of the event. | Scale-in automation was updated to independently progress region-by-region as opposed to acting across an entire market at once. Automated re-scaling in the case of detected issues is on the roadmap. |
| Kubernetes Scaling Policies were not consistently configured across the service portfolio leading to some services dropping capacity immediately instead of gradually over time. | SRE implemented a default Scale Down Policy which was applied across the full landscape of Max services. Unless explicitly overridden this ensures that all services gradually scale down over time. |
| Service was configured to read from the incorrect ElastiCache instance causing cache misses. While it could read directly from RDS once a specific RPS per pod threshold was reached the wait time of requests in an internal service queue would exceed service timeouts causing all subsequent calls to fail | The team reconfigured the service to point to the correct cache. SRE also took an action to increase the synthetic load generated while executing our suite of pre-launch fault injection tests to better expose situations where fail-open options may not function well under high volumes. |
Often times when trade-offs between cost and resilience are discussed it is with a focus on capacity and redundancy. How many instances of a service should we run? How many AZs or Regions should we deploy the capability? What I loved about this situation is how it highlighted how cost and resiliency are related in how we become more efficient. Our major takeaways from this scenario all increase the cost of operation. We’ve slowed down our scale-in automation and increased the load and scaling necessary to validate failure modes. However, this additional spending provides greater confidence in our ability to run the system leaner and more efficiently. It’s truly a scenario where spending a little extra both saves us more in the long run and makes our system more reliable!
Our commitment to make every moment matter
At Warner Bros. Discovery, storytelling is the product. Whether it’s a gripping series finale of Succession, a long-awaited return of The Last of Us, or cheering on your favorite team on TNT Sports on d+, every stream represents a promise: that the content will be there, ready to play, the moment a viewer presses “Watch.” Behind that promise is a complex, ever-evolving platform designed not just to deliver, but to do so reliably and efficiently.
Max’s journey—from its foundations in discovery+ and HBO Max, through the intensity of launch and the global rollout that followed—isn’t just a story of technology. It’s a story of alignment. Of building systems where cost, resilience, and user experience aren’t competing goals, but interconnected pillars. The teams at WBD aren’t just making the platform faster or cheaper— we are making it smarter. We’ve embraced observability, empowered engineers, challenged assumptions, and prioritized solutions that scale with the story. It’s through these efforts, and the culture fostered at WBD, that we were able to claim victory and accomplish our OKRs to build a more efficient and resilient system.
Because in streaming, every error is a missed moment, every outage a lost viewer. Ensuring the world can watch what WBD creates—when and how they want to—requires more than cloud horsepower. It requires clarity. It requires discipline. And it requires a belief that frugality, done right, doesn’t constrain ambition—it fuels it.
Building and maintaining efficient systems requires the right mission, the right insights, the right tools, and the right approach. WBD’s approach shows that when those elements come together, you don’t just keep the lights on. You keep the stories flowing.